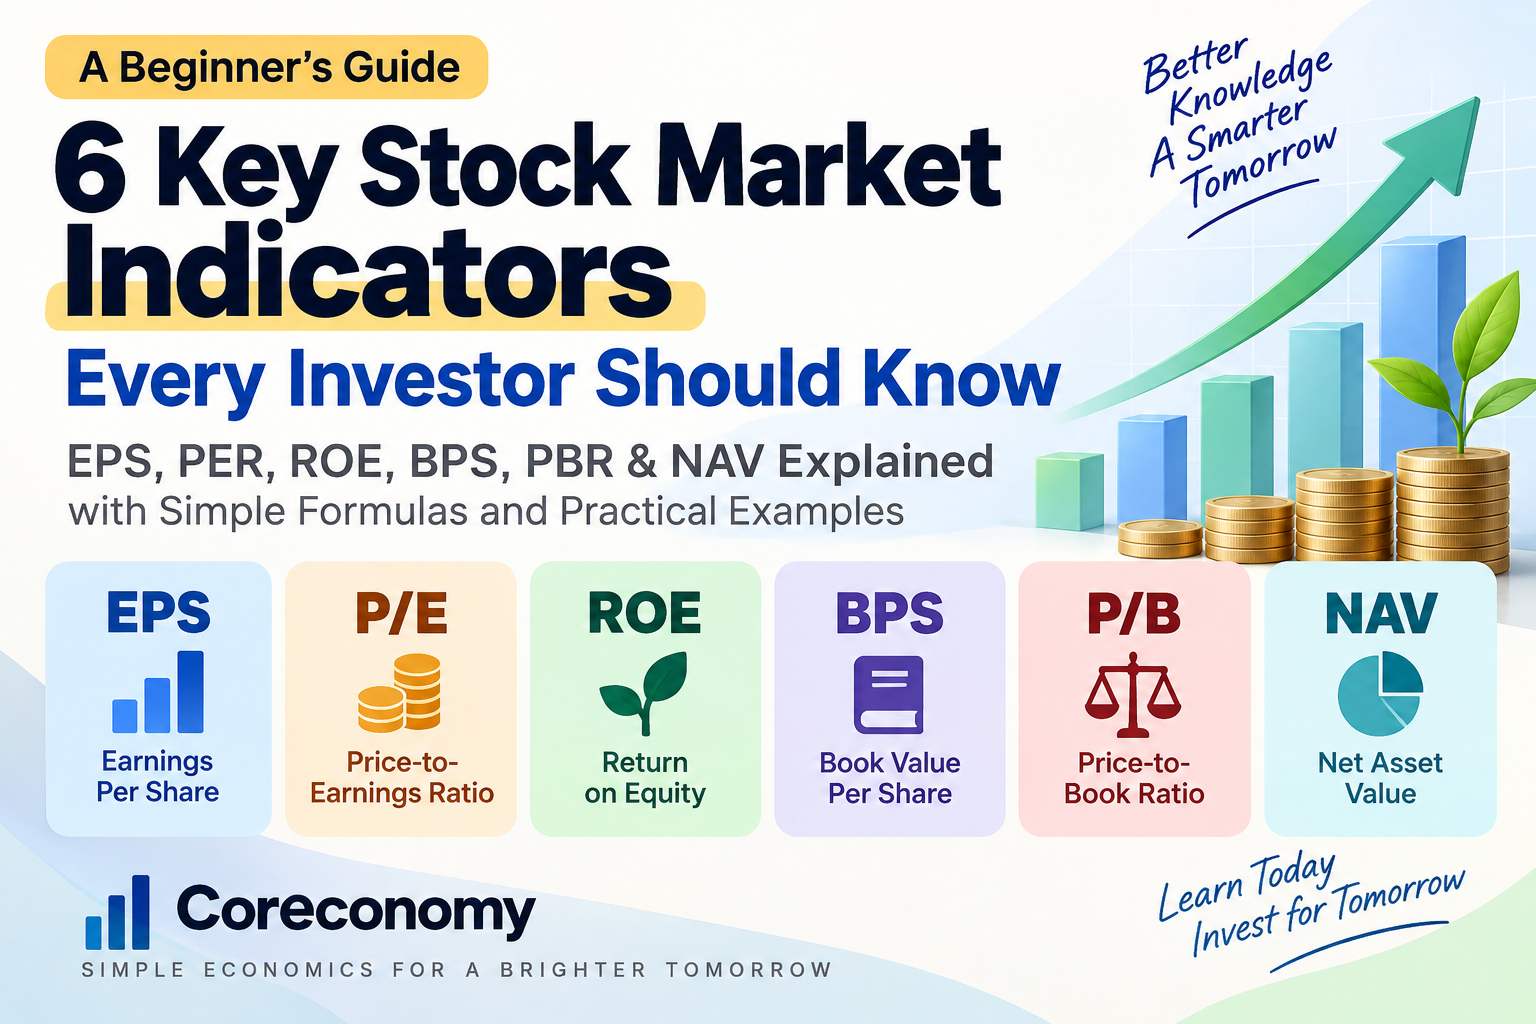
When you first start investing in stocks, you may come across many unfamiliar financial abbreviations.
EPS, PER, ROE, BPS, PBR, and NAV are among the most commonly used indicators for evaluating a company’s profitability, valuation, and asset value.
However, no single indicator can tell you whether a stock is a good investment.
The key is to understand what each indicator measures and how to use them together.
In this guide, we’ll explain six essential stock market indicators in simple terms and show you how investors can interpret them.
1. EPS — Earnings Per Share
What is EPS?
EPS stands for Earnings Per Share.
It measures how much net income is attributable to each share of common stock.
A simplified formula is:
EPS = Net Income ÷ Weighted Average Shares Outstanding
Companies may also report diluted EPS, which takes potentially dilutive securities such as stock options or convertible securities into account.
How should you interpret EPS?
A higher EPS generally means that a company is generating more earnings per share.
However, EPS should not be evaluated by looking at the number alone.
For example, a company with an EPS of $10 is not automatically a better investment than a company with an EPS of $2.
The share price, number of shares outstanding, business growth, and valuation all matter.
Investors should therefore compare EPS with:
- The company’s historical EPS
- EPS growth over time
- Similar companies in the same industry
- The current share price
Key takeaway
EPS tells you how much profit is attributable to each share, but EPS alone does not tell you whether a stock is cheap or expensive.
2. PER — Price-to-Earnings Ratio
PER is commonly called the P/E ratio in English-speaking markets.
It compares a company’s share price with its earnings per share.
Formula
P/E Ratio = Share Price ÷ EPS
For example, if a company’s share price is $100 and its EPS is $10:
P/E = $100 ÷ $10 = 10
This means investors are currently paying 10 times the company’s annual earnings per share.
Is a lower P/E always better?
Not necessarily.
A lower P/E may indicate that a stock is relatively inexpensive compared with its earnings, but it does not automatically mean that the stock is undervalued.
A company may have a low P/E because:
- Its earnings are expected to decline
- Its industry is facing structural problems
- The company has unusually high earnings that may not be sustainable
- Investors have low expectations for future growth
Likewise, a high P/E may reflect strong expectations for future earnings growth rather than simply meaning that the stock is overpriced.
How should investors use P/E?
P/E is more useful when compared with:
- Companies in the same industry
- The company’s own historical P/E range
- Expected future earnings growth
- Other valuation indicators
Key takeaway
P/E shows how much investors are paying for a company’s earnings. A low P/E can be attractive, but it should never be interpreted in isolation.
3. ROE — Return on Equity
ROE stands for Return on Equity.
It measures how effectively a company generates profit from shareholders’ equity.
Formula
A commonly used formula is:
ROE = Net Income ÷ Average Shareholders’ Equity × 100
For example, if a company generates $10 million in net income from an average shareholders’ equity of $50 million:
ROE = 10 ÷ 50 × 100 = 20%
Why is ROE important?
A consistently strong ROE can indicate that a company is using shareholders’ capital efficiently.
However, a high ROE does not automatically mean that a company is high quality.
Debt can affect ROE significantly. A company with relatively low equity and high leverage can sometimes report a high ROE.
Therefore, investors should also examine:
- Debt levels
- Profit margins
- Cash flow
- Earnings stability
- ROE trends over several years
- ROE compared with competitors
There is no universal ROE number that makes every company attractive.
A 15% ROE may be excellent for one industry but ordinary for another.
Key takeaway
ROE measures how efficiently a company generates profit from shareholders’ equity. Look for sustainable ROE rather than simply the highest number.
4. BPS — Book Value Per Share
BPS stands for Book Value Per Share.
It represents the amount of shareholders’ equity attributable to each share.
Formula
BPS = Shareholders’ Equity ÷ Shares Outstanding
Book value is based on accounting values reported on the company’s balance sheet.
What does BPS tell investors?
BPS provides an indication of the net assets backing each share.
However, BPS should not be interpreted as the exact amount shareholders would receive if the company were liquidated.
In an actual liquidation, assets may be sold for more or less than their accounting values, and additional costs and obligations may arise.
Therefore, BPS is best understood as an accounting measure of net assets per share rather than a guaranteed liquidation value.
Key takeaway
BPS shows the book value of net assets attributable to each share. It becomes especially useful when considered together with the stock price and P/B ratio.
5. PBR — Price-to-Book Ratio
PBR is commonly called the P/B ratio in English-speaking markets.
It compares a company’s market price with its book value per share.
Formula
P/B Ratio = Share Price ÷ BPS
For example, if a stock trades at $60 and its BPS is $50:
P/B = $60 ÷ $50 = 1.2
This means the market is valuing the company’s equity at 1.2 times its book value.
What does a P/B below 1 mean?
If P/B is below 1, the market price is lower than the company’s book value per share.
However, this does not automatically mean that the stock is undervalued.
The market may be assigning a low valuation because:
- The company’s profitability is weak
- Its assets may be difficult to monetize
- Its earnings may be declining
- The business may face structural problems
- Investors expect poor future returns
This is why P/B is often more informative when combined with ROE.
For example, a company with a low P/B and sustainably strong ROE may deserve closer attention than a company with a low P/B but persistently weak profitability.
Key takeaway
P/B compares a company’s market value with its accounting book value. A P/B below 1 can be interesting, but it is not proof of undervaluation.
6. NAV — Net Asset Value
NAV stands for Net Asset Value.
The basic concept is:
NAV = Total Assets − Total Liabilities
For investment funds, ETFs, and similar products, NAV is often expressed on a per-share or per-unit basis:
NAV Per Share = Net Assets ÷ Shares or Units Outstanding
NAV is particularly important for funds, ETFs, REITs, and other investment vehicles whose value is closely related to the assets they hold.
NAV and market price
An investment product can sometimes trade at a price above or below its NAV.
- Premium: Market price is higher than NAV
- Discount: Market price is lower than NAV
For example, if an ETF’s NAV per share is $100 but it trades at $102, it is trading at a 2% premium to NAV.
If it trades at $98, it is trading at a 2% discount.
For some assets, NAV may be calculated using current market prices, while book value is based primarily on accounting values. However, the usefulness of NAV depends on how accurately the underlying assets can be valued.
Key takeaway
NAV is a measure of the net value of the assets underlying an investment vehicle. It is useful for understanding whether a market price is trading at a premium or discount to its underlying net assets.
A Quick Summary of the 6 Indicators
| Indicator | Full Name | What It Measures | How to Use It |
|---|---|---|---|
| EPS | Earnings Per Share | Earnings attributable to each share | Compare profitability and earnings growth |
| P/E | Price-to-Earnings Ratio | Price relative to earnings | Compare valuation with peers and historical levels |
| ROE | Return on Equity | Profit generated from shareholders’ equity | Evaluate profitability and capital efficiency |
| BPS | Book Value Per Share | Book value of net assets per share | Examine the company’s accounting net assets |
| P/B | Price-to-Book Ratio | Price relative to book value | Compare market valuation with book value |
| NAV | Net Asset Value | Net assets after liabilities | Evaluate underlying asset value, especially for funds and ETFs |
How Should Investors Use These Indicators Together?
The real value of these indicators comes from combining them rather than looking at them individually.
A simple way to approach a stock is:
Step 1. Start with profitability
Look at EPS and ROE.
- Is the company profitable?
- Are earnings growing?
- Is ROE consistently strong?
- Is the profitability sustainable?
Step 2. Look at valuation
Next, examine P/E and P/B.
- How much are investors paying for the company’s earnings?
- How does its valuation compare with competitors?
- Is the current valuation high or low compared with its own history?
Step 3. Examine the balance sheet
Use BPS and other balance-sheet information to understand the company’s financial foundation.
- Is shareholders’ equity growing?
- Does the company have excessive debt?
- Are the underlying assets strong enough to support the business?
Step 4. Consider NAV when appropriate
For ETFs, funds, REITs, and asset-heavy investment vehicles, NAV can provide another useful reference point.
The important point is that these indicators answer different questions.
EPS → How much profit is generated per share?
ROE → How efficiently is shareholders’ equity being used?
P/E → How much are investors paying for those earnings?
BPS → How much accounting net asset value is attributable to each share?
P/B → How does the market price compare with that book value?
NAV → What is the net value of the underlying assets?
When these indicators are considered together, investors can develop a more complete picture of a company’s profitability, valuation, and financial position.
Conclusion
EPS, P/E, ROE, BPS, P/B, and NAV are some of the most useful basic indicators for investors learning how to analyze stocks.
But none of them should be treated as a simple “buy” or “sell” signal.
A low P/E does not automatically mean a stock is cheap.
A high ROE does not automatically mean a company is excellent.
A P/B below 1 does not automatically mean a stock is undervalued.
And NAV is not necessarily the same thing as a company’s intrinsic value.
The most useful approach is to understand what each indicator measures, compare it with relevant companies and historical data, and then combine the information with the company’s financial statements, industry conditions, and future growth prospects.
Understanding the numbers is the first step toward making more informed investment decisions.