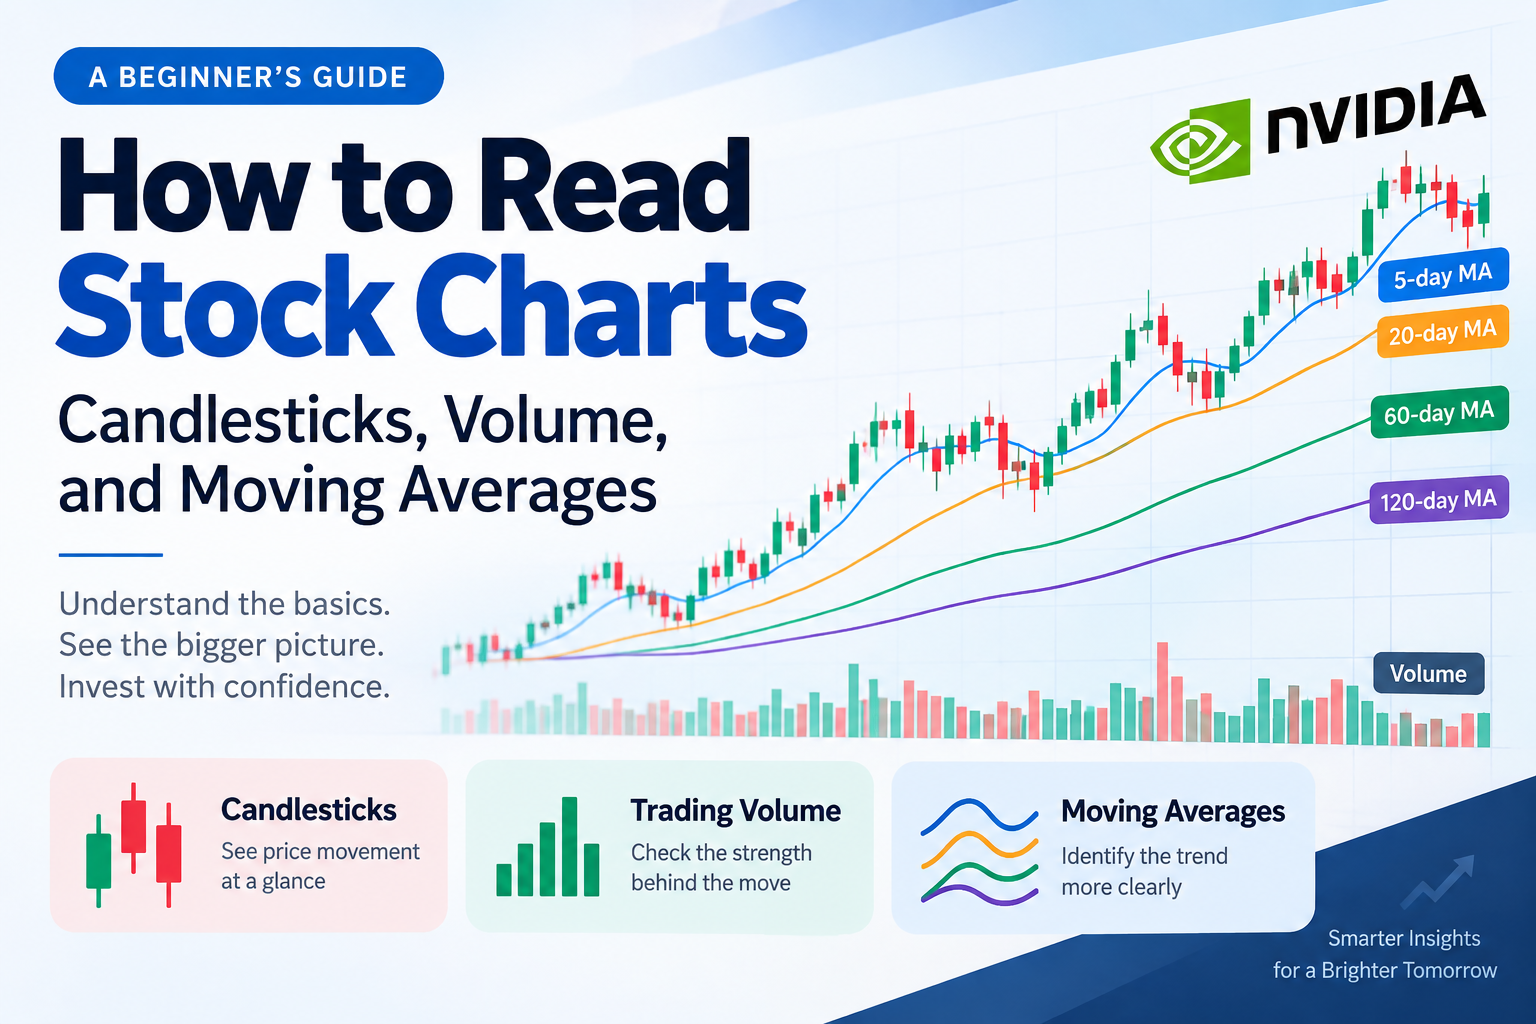
When you first start investing in stocks, a stock chart can look like a confusing collection of candles, lines, and numbers.
But once you understand the basic structure, a stock chart becomes a useful tool for examining how prices have moved in the past and how recent trends are developing.
In this guide, we’ll explain three of the most important building blocks of a stock chart:
- Candlesticks
- Trading volume
- Moving averages
We’ll also look at how these elements can be considered together using a real NVIDIA (NVDA) chart as an example.
1. The Basics of a Stock Chart: How to Read Candlesticks
The first thing most beginners notice on a stock chart is the candlestick.
A candlestick shows how the price of a stock moved during a specific period.
For example, on a daily chart, one candlestick represents one trading day.
Each candlestick contains four basic pieces of price information:
- Open: The price at the beginning of the period
- Close: The price at the end of the period
- High: The highest price reached during the period
- Low: The lowest price reached during the period
Bullish and Bearish Candlesticks
A bullish candlestick means that the closing price was higher than the opening price.
A bearish candlestick means that the closing price was lower than the opening price.
The exact colors depend on the market and charting platform. For example, many U.S. stock charts use green for bullish candles and red for bearish candles, while other markets or platforms may use different colors.
The wider part of the candlestick is called the body.
The thin lines extending above and below the body are called wicks or shadows. They show the highest and lowest prices reached during that period.
By looking at a single candlestick, you can therefore see the range in which the stock traded and how the opening and closing prices compared.
2. What Does Trading Volume Mean?
The bars shown below the price chart usually represent trading volume.
On a daily chart, volume generally represents the number of shares traded during that trading session.
Looking at price and volume together can provide additional context.
For example, if a stock rises while trading volume is significantly higher than usual, you can see that the price increase occurred alongside heavier trading activity.
Likewise, if a stock falls while volume increases sharply, unusually active trading accompanied the decline.
However, volume alone does not tell you exactly why the price moved or whether the move will continue.
The most useful approach is to consider price movement and volume together.
3. A Tool for Identifying Trends: Moving Averages
Stock prices can fluctuate significantly from day to day.
A moving average (MA) helps smooth out some of this short-term noise, making it easier to examine the broader direction of a stock’s price.
What Is a Moving Average?
A simple moving average, or SMA, is calculated by averaging prices over a specified period and continuously updating that average as new data becomes available.
For example, a 20-day simple moving average on a daily chart is based on the average of the prices over the most recent 20 trading days.
A moving average should not be interpreted as the average purchase price of investors who bought the stock during that period.
Individual investors buy shares at different prices, so a moving average does not directly measure investors’ average cost.
Instead, it is a mathematical average of historical price data used to help analyze trends.
4. What Is the Difference Between 5-, 20-, 60-, and 120-Day Moving Averages?
Moving averages can be calculated using different time periods.
The shorter the period, the more quickly the moving average responds to recent price changes. Longer periods produce smoother lines but react more slowly to new price movements.
① 5-Day Moving Average
The 5-day moving average reflects the recent five trading days.
Because it responds quickly to price changes, it can be useful when examining very short-term price movements.
② 20-Day Moving Average
The 20-day moving average reflects roughly one month of trading days.
It is commonly used to examine short-term to intermediate price trends.
If the stock price remains above the 20-day moving average, the recent price trend may be relatively strong compared with its recent average.
However, falling below the 20-day moving average does not automatically mean that a long-term downtrend has begun.
③ 60-Day Moving Average
The 60-day moving average reflects a longer period and can be useful for examining medium-term trends.
Investors may look at whether the moving average is rising or falling and whether the stock price is trading above or below it.
However, a 60-day moving average should not be treated as a direct measure of institutional or foreign investors’ average purchase price or buying activity.
④ 120-Day Moving Average
The 120-day moving average captures a longer period of price history and can be useful when examining intermediate- to longer-term trends.
Because longer moving averages incorporate more historical data, they tend to be less sensitive to short-term fluctuations and respond more slowly to changes.
Therefore, a stock trading above its 120-day moving average does not automatically mean that the market is in a bull market, just as trading below it does not automatically prove that a bear market has begun.
5. How Should You Interpret Moving Averages?
Moving averages are best understood as technical analysis tools, rather than automatic buy or sell signals.
The Relationship Between Price and the Moving Average
Suppose a stock is rising while its moving average is also trending upward.
This may suggest that the price trend has remained relatively strong over that period.
On the other hand, if the stock price is below a declining moving average, it may indicate that the downward trend deserves attention.
However, these signals are not always reliable.
Prices can move above and below a moving average repeatedly, especially when a stock is moving sideways.
This can create false or temporary signals.
6. Golden Crosses and Death Crosses
Two well-known moving-average signals are the Golden Cross and Death Cross.
A Golden Cross generally refers to a shorter-term moving average crossing above a longer-term moving average.
A Death Cross generally refers to a shorter-term moving average crossing below a longer-term moving average.
These signals are sometimes used to assess potential changes in price trends.
However, neither signal guarantees that a stock will rise or fall afterward.
They are more useful when considered alongside:
- Price action
- Trading volume
- Company earnings
- Financial condition
- Broader market conditions
7. How Can You Read a Stock Chart in Practice?
When looking at a real stock chart, it is usually more useful to examine several elements together rather than focusing on a single signal.
First, examine the overall price direction.
Are recent highs and lows moving upward?
Or are both highs and lows gradually moving downward?
This can provide a basic picture of the current trend.
Second, look at trading volume.
Check whether trading activity has increased or decreased as the stock price moves.
Third, examine the direction of the moving averages.
Look at whether the 5-, 20-, 60-, and 120-day moving averages are rising, falling, or moving sideways.
Fourth, examine the relationship between price and the moving averages.
Is the current stock price above or below important moving averages?
Are those moving averages themselves rising or falling?
Putting these observations together can provide a more structured way to interpret a chart than simply looking at whether the stock price is up or down.
8. A Real-World Example: Reading an NVIDIA Chart
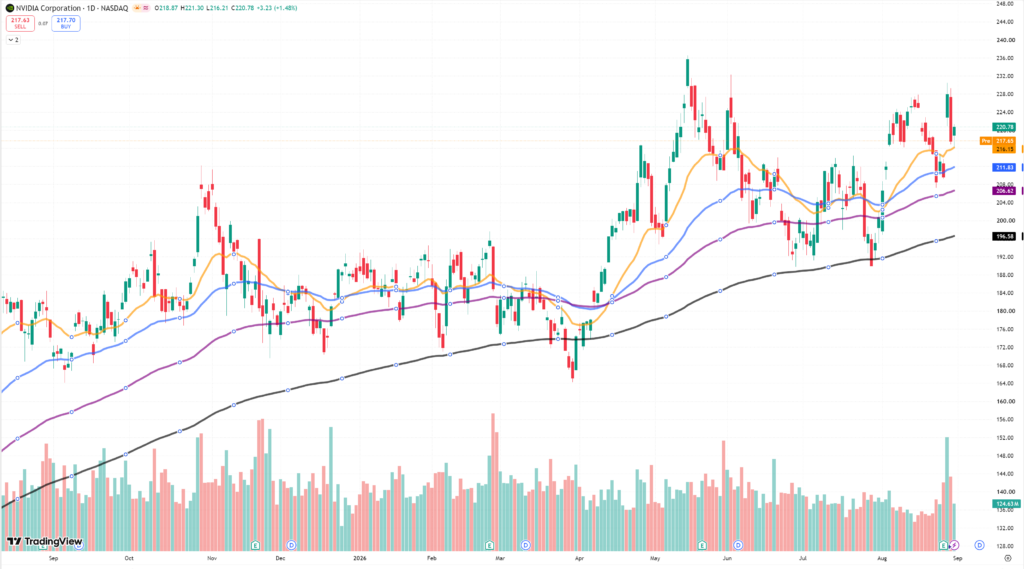
A real stock chart can make these concepts much easier to understand.
On an NVIDIA daily chart, you can display the stock price together with several moving averages and trading volume.
For example, if the stock price moves below the 20-day moving average, you might interpret that as a sign that the short-term price trend has weakened.
If the price also moves below a longer-term moving average such as the 60-day moving average, you can investigate whether the medium-term trend is weakening as well.
On the other hand, if the stock price moves back above important moving averages and those averages begin to slope upward, you can examine whether the trend is improving.
The important point is not to treat any single price level as an absolute rule.
Instead, look at:
Price direction + moving-average direction + trading volume
as a combination of signals.
Also remember that a chart alone cannot tell you whether institutions or foreign investors were responsible for a particular price move, or whether a decline was caused by profit-taking.
To investigate those questions, you would need additional information such as trading-flow data, company earnings, regulatory filings, and market news.
9. Can You Make Investment Decisions Using Charts Alone?
Stock charts are useful, but a chart cannot tell you everything about a company.
Charts primarily show historical price and trading activity.
To understand the underlying business, investors may also need to examine:
- Revenue
- Operating profit
- Net income
- Cash flow
- Debt
- Shareholders’ equity
- Growth prospects
- Industry conditions
The financial indicators we discussed in the previous article, such as EPS, P/E, ROE, BPS, P/B, and NAV, can also help provide additional context.
👉 6 Key Stock Market Indicators Every Investor Should Know
Stock-chart analysis and fundamental analysis are therefore not necessarily competing approaches.
They provide different types of information that can complement each other.
Conclusion
You do not need to understand every line and number on a stock chart at once.
Start with the basics:
Candlesticks → Volume → Moving Averages
Then gradually learn how price movements, trading volume, and moving averages can be considered together.
A stock chart is not a tool that can perfectly predict the future.
Instead, it is a way to examine historical price behavior and develop a better understanding of the current market trend.
Rather than treating a single technical signal as a definitive investment decision, consider it alongside the company’s financial condition, earnings, industry environment, and broader market conditions.
The goal of reading a stock chart is not to predict the future perfectly. It is to understand what is happening in the market more objectively.