What Are Leading Economic Indicators? How to Read the Economic Outlook

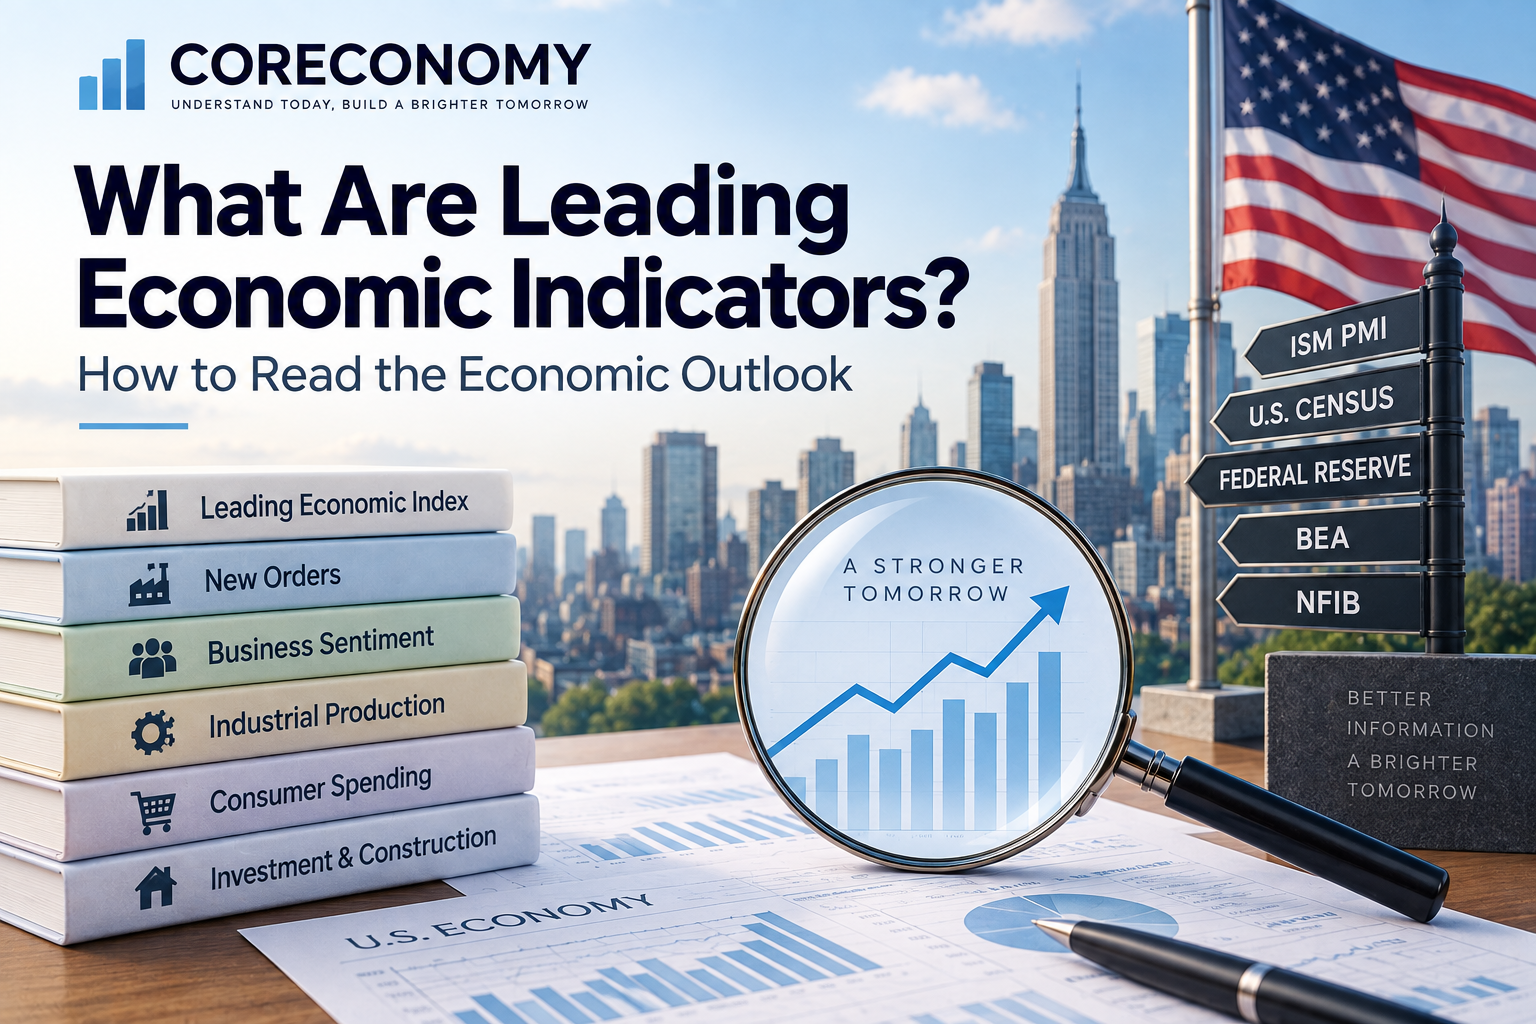
Leading economic indicators explained with the U.S. skyline, economic charts, the Leading Economic Index, new orders, business sentiment, industrial production, consumer spending, investment and construction, and the CORECONOMY logo.

When you read economic news, you often see phrases such as “leading economic indicators are weakening” or “leading indicators are pointing to a slowdown.” But what exactly are leading economic indicators? Where can you find them, and how should you interpret them when they move? Leading economic indicators are not numbers that can predict the … Read more

What Is a Recession? Causes of Recessions and Their Impact on the Economy

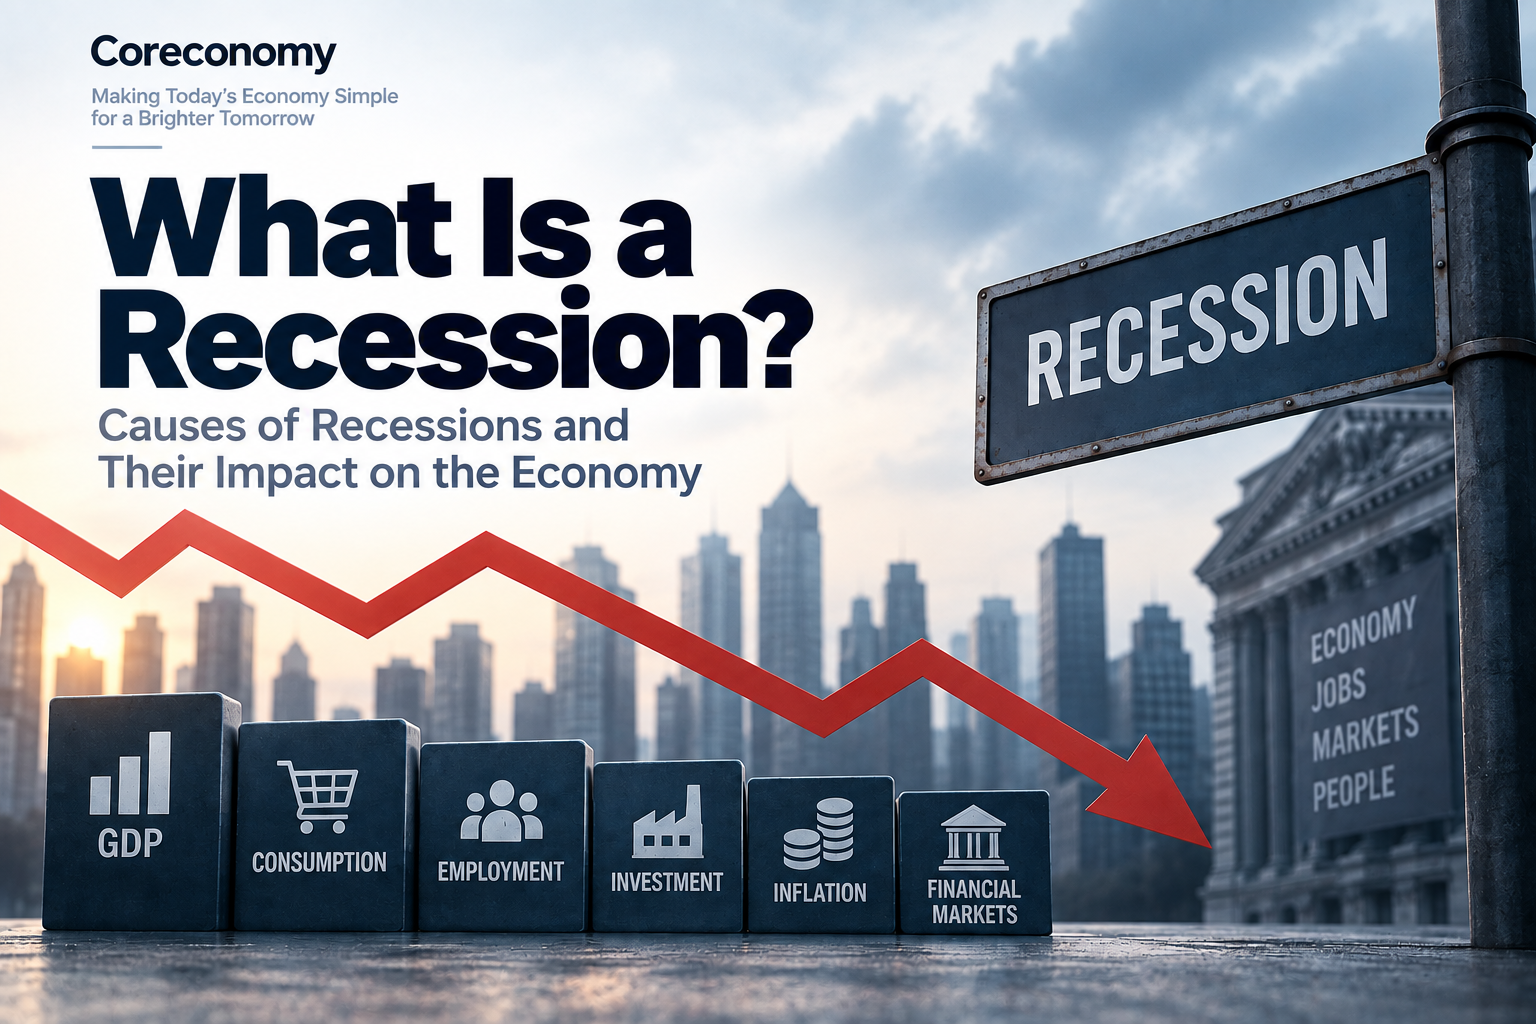
Coreconomy illustration explaining what a recession is, with a falling economic trend and GDP, consumption, employment, investment, inflation, and financial markets

When you read economic news, you often see phrases such as “recession risk,” “recession fears,” or “the economy is entering a recession.” But what exactly is a recession? Does a recession mean that the economy has stopped growing completely? Does two consecutive quarters of declining GDP automatically mean a recession? And what happens to employment, … Read more

What Is a Credit Spread? Understanding the Difference Between Corporate and Treasury Bond Yields

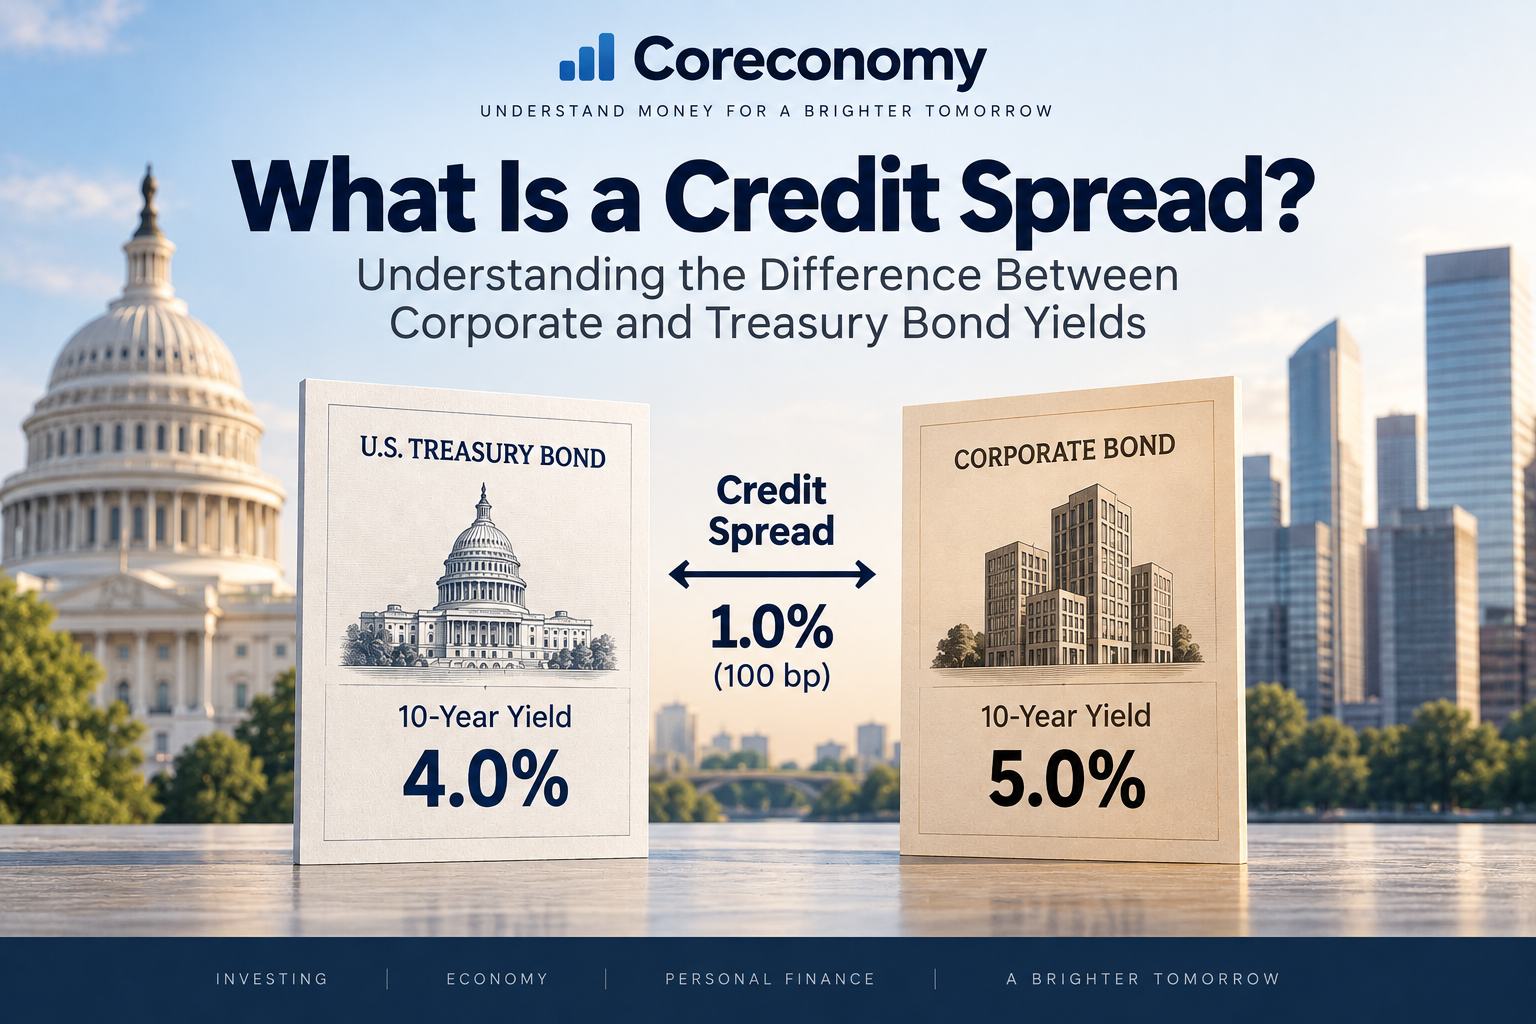
Coreconomy graphic showing a 4% U.S. Treasury 10-year yield, a 5% corporate bond yield, and the resulting 1 percentage point (100 bp) credit spread.

When you look at bond yields, you may notice that bonds with similar maturities can still offer very different interest rates. For example, suppose the 10-year U.S. Treasury yield is 4% while a 10-year corporate bond yields 5%. The difference is 1 percentage point. Why would investors demand a higher yield from one bond than … Read more

What Is the Yield Curve? Understanding the 2-Year and 10-Year Treasury Yield Spread

U.S. Treasury yield curve showing normal, flat, and inverted curves with 2-year and 10-year yields

When you read financial news, you may come across headlines like: “The U.S. Treasury yield curve is inverted.”“The 2-year/10-year yield spread has widened.”“The 10-year Treasury yield has risen above 5%.” For someone new to economics or investing, these terms can be confusing. What exactly is a yield curve? Why do investors pay so much attention … Read more

What Is the U.S. Federal Funds Rate? How Does the Federal Reserve Set Interest Rates?

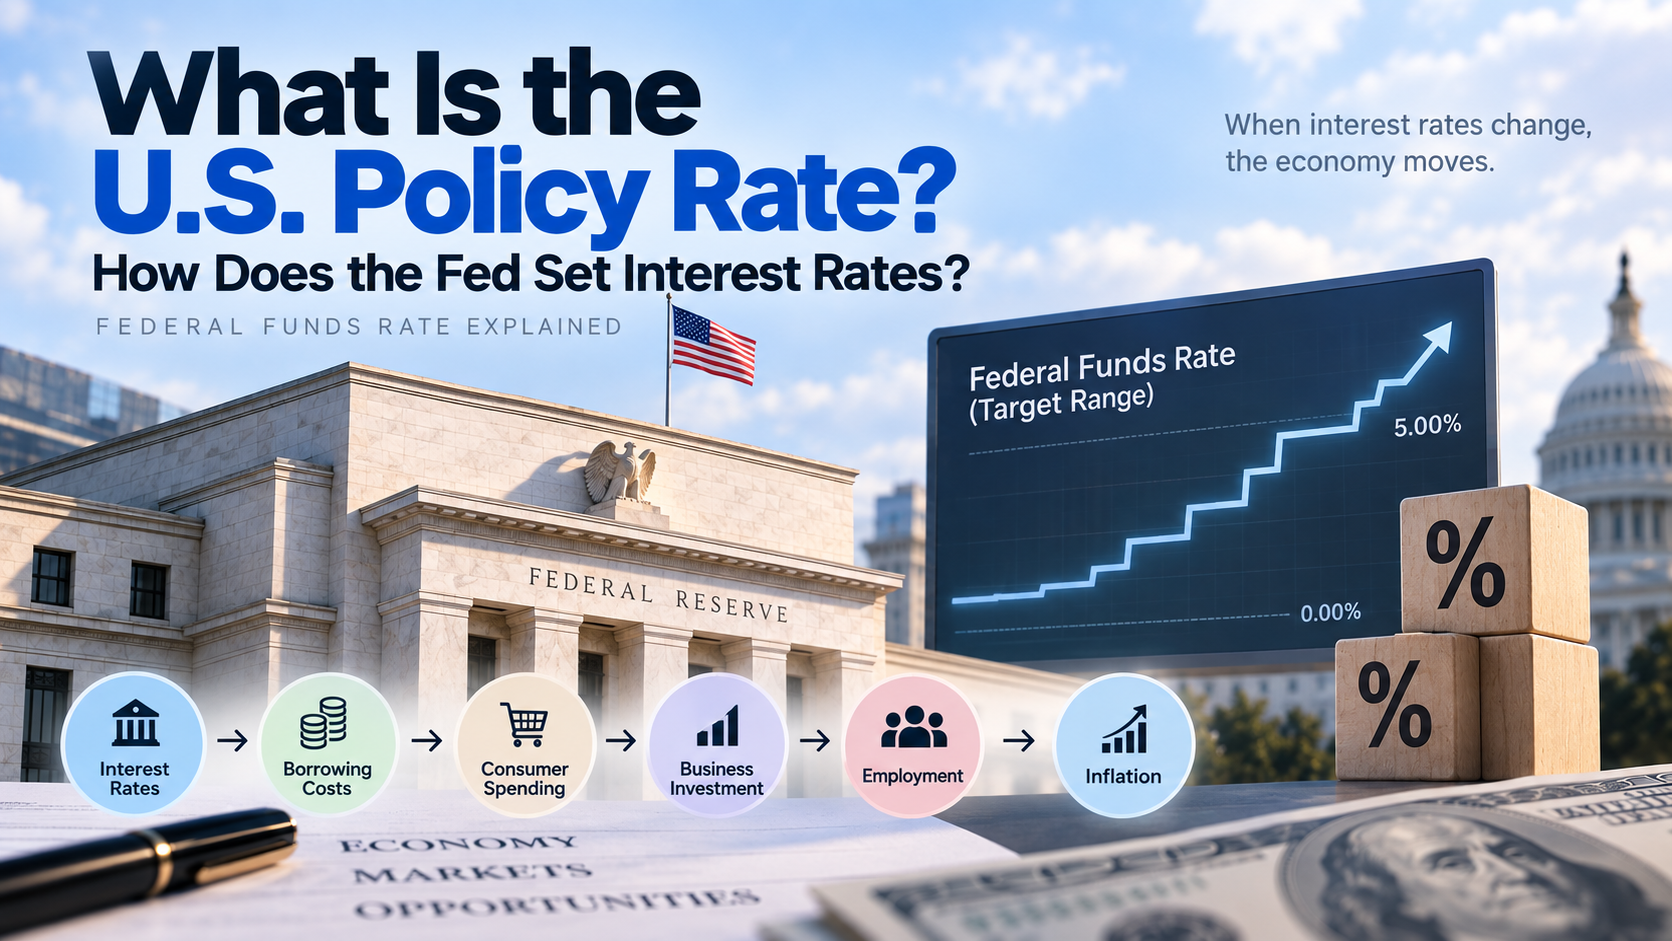
Infographic explaining the U.S. policy rate, Federal Funds Rate target range, Federal Reserve decisions, borrowing costs, employment, and inflation

When you read financial news, you will often see headlines like: “The Federal Reserve raised interest rates by 0.25 percentage points.” “The Fed kept interest rates unchanged.” “U.S. interest rates remain high.” But what exactly is the U.S. interest rate that people are talking about? Why does Google show something like: 4.00%–4.25% instead of one … Read more

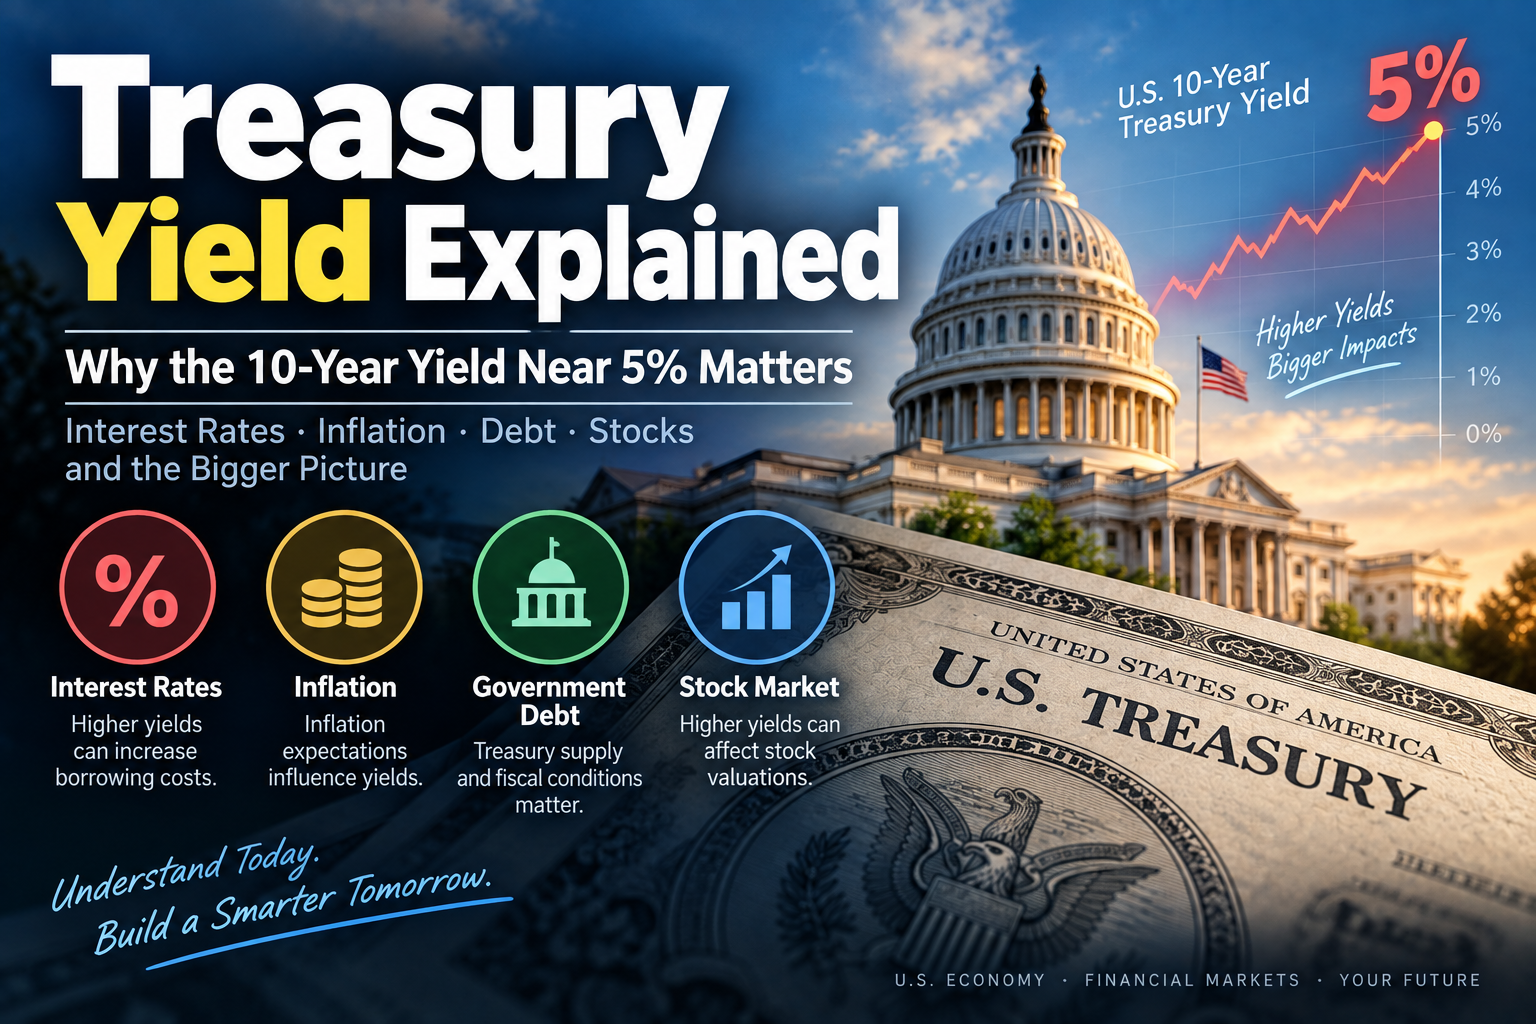
Why the U.S. 10-Year Treasury Yield Near 5% Matters: Interest Rates, Inflation, Debt, and Stocks

Infographic explaining Treasury yields, the U.S. 10-year Treasury yield near 5%, inflation, government debt, and stock market impacts

Economic news often says things like: “The U.S. 10-year Treasury yield is approaching 5%.” “Rising Treasury yields are putting pressure on stocks.” “Higher long-term rates are increasing borrowing costs for households and businesses.” But if you are new to economics, you may wonder: “Why does the interest rate on U.S. government debt affect my stocks?” … Read more