Economic news is full of phrases like:
“Government debt is too high.”
“Household debt is becoming a problem.”
“Higher interest rates are increasing debt-service costs.”
“The economy may eventually need to deleverage.”
But what does debt actually have to do with the business cycle?
At first, debt seems simple.
You borrow money today and repay it later.
But when we look at an entire economy, debt becomes much more important.
One person’s debt is often another person’s financial asset. Borrowing can increase spending and investment today, while also creating obligations for the future.
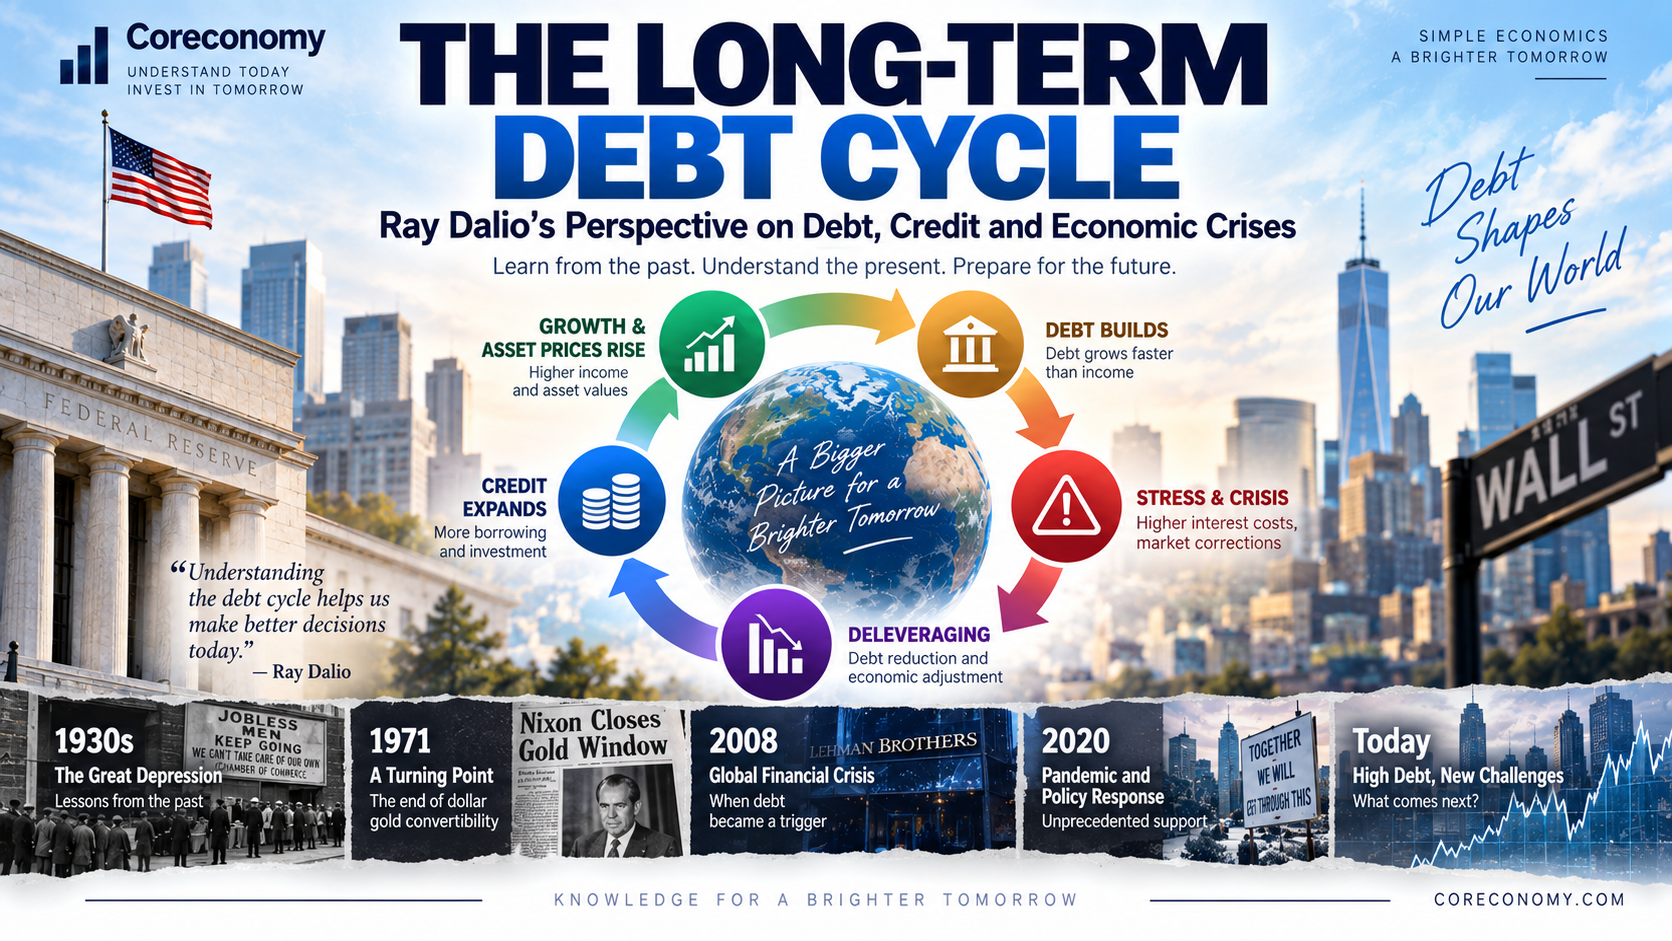
Ray Dalio developed the idea of a long-term debt cycle as a framework for studying how credit expands over long periods and how excessive debt burdens can eventually lead to deleveraging and major economic adjustments. His work compares historical debt crises across countries and periods rather than presenting a precise formula for predicting the future.
The key point is:
The long-term debt cycle is a framework for understanding historical debt crises, not a fixed economic law that repeats on an exact schedule.
In this guide, we’ll start with the basics of credit and debt, then examine how debt can support growth, why excessive leverage can become a problem, what deleveraging means, and what we can learn from the 1930s, Japan, 2008, and the post-pandemic era.
1. What Are Credit and Debt?
Let’s start with the simplest possible example.
Imagine someone earns:
$3,000 per month
but needs $50,000 today to buy a home, start a business, or make another major investment.
Their current income alone may not be enough.
So they borrow $50,000 from a bank.
The result is:
Purchasing power today ↑
but also:
Repayment obligations in the future ↑
This is the basic idea behind credit.
A useful way to think about credit is:
Credit allows future income to support spending or investment today.
For the borrower, it is a liability.
For the lender, it is an asset.
That’s why debt is never simply “money that disappears.”
It creates a financial relationship between two sides of the economy.
2. Is Debt Bad for the Economy?
Not at all.
Credit is an essential part of a modern economy.
Imagine a company wants to build a new factory.
It does not currently have enough cash to finance the entire project, so it borrows.
The new factory could eventually lead to:
More production
↓
More sales
↓
More employment
↓
Higher incomes
↓
More tax revenue and consumption
In this case, borrowing can help support productive economic activity.
The problem is not debt itself.
The problem arises when:
Debt grows faster than the income and cash flow needed to service it.
A business that borrows to expand productive capacity may be creating future income.
A household that repeatedly borrows simply to maintain consumption may be creating a much more difficult repayment problem.
So when studying debt, an important question is not simply:
“How much debt exists?”
but:
“How much debt exists relative to the income and assets supporting it?”
3. How Can Debt Help an Economy Grow?
Let’s imagine a household that earns $3,000 per month.
Without borrowing, its spending capacity is largely limited by its current income and savings.
Now suppose it takes out a mortgage and buys a house.
That transaction creates economic activity involving:
- Banks
- Construction companies
- Contractors
- Real-estate services
- Furniture companies
- Appliance manufacturers
The credit system allows spending to happen before the full income supporting that spending has been earned.
This can stimulate economic activity.
But there is a catch:
The borrowed money does not disappear.
Eventually the borrower must repay:
Principal + interest
So credit can bring future purchasing power into the present, but it also brings future repayment obligations into the future.
4. What Happens When Debt Keeps Growing?
At first, rising debt may not look dangerous.
Imagine:
Annual income = $60,000
Debt = $150,000
That might be manageable depending on the interest rate, asset value, and cash flow.
Now imagine:
Annual income = $65,000
Debt = $250,000
And later:
Annual income = $70,000
Debt = $350,000
Debt is growing much faster than income.
As long as:
- Interest rates remain low
- Asset prices stay high
- Credit remains available
- Income continues to rise
the system may keep functioning.
But if one of those assumptions changes, the situation can deteriorate quickly.
5. Why Are Interest Rates So Important?
Suppose a borrower has:
$1 million of debt
At an average interest rate of:
2%
the annual interest cost is:
$20,000
Now imagine the interest rate rises to:
5%
The annual interest cost becomes:
$50,000
The principal has not changed.
But the interest burden has increased by:
$30,000 per year
This is why highly leveraged economies can become especially sensitive to higher interest rates.
The same principle applies to:
- Households
- Companies
- Banks
- Governments
The more debt an economic sector carries, the more important its refinancing costs and interest burden become.
This is one reason the relationship between interest rates, bonds, and debt is so important.
6. What Is the Long-Term Debt Cycle?
Ray Dalio’s long-term debt cycle is a framework for thinking about what can happen when credit expands for many years.
Source: Ray Dalio — Big Debt Crises
A simplified version looks like this:
Credit expands
↓
Spending and investment rise
↓
Incomes and asset prices rise
↓
Borrowing capacity increases
↓
More credit is created
This can become a self-reinforcing process.
For example, imagine house prices are rising.
Higher house prices can increase:
Home equity
↓
Borrowing capacity
↓
Mortgage availability
↓
Housing demand
Higher demand can then push prices up further.
This does not mean every increase in credit creates a bubble.
It means that credit can amplify economic and asset-market cycles.
7. Why Can Excessive Debt Become a Problem?
Eventually, debt may grow faster than the income supporting it.
Imagine:
Income = $60,000
Debt = $150,000
becoming:
Income = $70,000
Debt = $350,000
The problem is not just the size of the debt.
The problem is the relationship between:
Debt → Interest payments → Income → Cash flow
If interest rates rise while income growth slows, debt servicing becomes harder.
That can lead to:
Higher interest costs
↓
Less household spending
↓
Less business investment
↓
Weaker economic growth
In more severe situations, borrowers may be forced to sell assets.
That can create another feedback loop.
8. How Can Debt Problems Become Asset-Price Problems?
Consider a homeowner who has:
Home value = $500,000
Mortgage debt = $400,000
If the home rises to $600,000, the owner’s equity increases.
But what if the price falls to $300,000?
Now:
Home value = $300,000
Debt = $400,000
The borrower has negative equity.
If large numbers of borrowers are in the same position, banks and financial institutions can face greater losses.
The process can become:
Falling asset prices
↓
Lower collateral values
↓
Tighter lending
↓
Less spending and investment
↓
Weaker economic activity
↓
Further pressure on asset prices
This is one reason excessive leverage can make financial downturns much more severe.
9. What Can We Learn From Historical Debt Crises?
History provides several useful case studies.
Ray Dalio compares major debt crises across different countries and periods, including the United States in the 1930s, Japan, and the global financial crisis. His approach emphasizes recurring patterns while recognizing that the details of each crisis differ.
The United States in the 1930s
The Great Depression involved severe financial stress, falling asset prices, banking problems, deflation, and a dramatic contraction in economic activity.
Japan
Japan’s late-1980s asset bubble was followed by a prolonged adjustment involving falling land and equity prices, banking stress, and weak economic growth.
The United States in 2008
The global financial crisis began with severe stress in housing and mortgage-related financial markets and spread through the financial system and global economy.
The important lesson is:
These crises can be compared, but they should not be treated as identical events caused by one universal formula.
Each one involved different institutions, policies, financial structures, and economic conditions.
10. What Changed in the Global Monetary System After 1971?
The year 1971 is often mentioned in discussions about long-term debt and monetary systems.
In August 1971, the United States suspended the convertibility of dollars into gold for foreign governments and central banks.
This marked a major turning point in the Bretton Woods monetary system.
The Federal Reserve notes that official dollar convertibility into gold ended in 1971 and that major currencies moved toward floating exchange rates by 1973.
Source: Federal Reserve — A Brief Illustrated History of the Federal Reserve’s Balance Sheet
This transition mattered because modern monetary systems eventually became centered on fiat currencies, rather than a fixed gold-convertibility system.
However, it would be misleading to say:
“1971 happened, gold disappeared, and governments could simply print unlimited money.”
Debt growth depends on many factors, including:
- Government fiscal policy
- Private borrowing
- Bank credit creation
- Interest rates
- Economic growth
- Financial regulation
- Monetary policy
So 1971 was an important monetary-system transition, but it does not by itself explain decades of global debt accumulation.
11. What Happened During the 2008 Financial Crisis?
The 2008 crisis is especially important because it shows how governments and central banks can respond to a severe debt and financial shock.
Two policies are often mentioned together:
TARP
and:
Quantitative Easing (QE)
But they were not the same thing.
TARP
The U.S. Treasury created the Troubled Asset Relief Program (TARP) to help stabilize the financial system.
One of its major early components was the Capital Purchase Program, through which Treasury purchased preferred shares from participating financial institutions to strengthen their capital.
Source: U.S. Department of the Treasury — TARP Capital Purchase Program
In simple terms:
TARP = government financial-stabilization and capital-support program
QE
The Federal Reserve used large-scale asset purchases as a monetary-policy tool.
The Fed purchased:
- Agency debt
- Mortgage-backed securities
- Longer-term U.S. Treasury securities
with the goal of putting downward pressure on longer-term interest rates and easing financial conditions.
Source: Federal Reserve — Timeline: Balance Sheet Policies
The broader role of quantitative easing in changing financial conditions is explained in Understanding Quantitative Easing (QE).
So:
TARP ≠ QE
They were different policies responding to the same broad financial crisis.
12. Did the 2008 Response Simply “Create More Debt”?
It is common to hear:
“The government solved the crisis by taking on more debt.”
There is some intuition behind that statement, but it is too simple.
The actual response included:
- Interest-rate cuts
- Liquidity facilities
- Bank recapitalization
- Fiscal measures
- Asset purchases
- Emergency lending
- Financial-sector reforms
Different parts of the financial system took on different risks and liabilities.
A better question is:
How did the crisis response change the distribution and structure of debt and financial assets?
That is more useful than simply saying:
“They added more debt.”
13. What Happened After the COVID-19 Shock?
The pandemic created another enormous economic shock.
In 2020:
Economic activity collapsed
↓
Governments increased fiscal support
↓
Central banks eased financial conditions
↓
Economic activity recovered
But the post-pandemic environment was different from 2008.
The recovery was followed by:
Strong demand
+
Supply-chain disruptions
+
Labor-market changes
+
Energy and commodity shocks
Inflation became much more persistent.
Central banks then moved in the opposite direction:
Monetary easing → Monetary tightening
Interest rates increased and balance sheets began to shrink.
This is important because it shows that the same policy tools can produce different economic outcomes depending on the conditions in which they are used.
To understand how inflation, deflation, and weak economic growth interact, see Inflation, Deflation, and Stagflation Explained.
14. What Is Deleveraging?
This brings us to another key concept:
Deleveraging.
Leverage means using debt to increase financial exposure.
So deleveraging means:
Reducing debt and leverage relative to assets, income, or the size of the economy.
Imagine:
Debt = $10 million
and the borrower sells assets and repays $3 million.
Now:
Debt = $7 million
That is a simple example of deleveraging.
But the process becomes much more complicated when an entire economy tries to deleverage at the same time.
15. Why Can Deleveraging Be Painful?
Imagine:
- Households reduce spending
- Companies reduce investment
- Banks tighten lending
- Governments cut spending
Each decision may make sense individually.
A household wants to pay down debt.
A company wants to strengthen its balance sheet.
A bank wants to reduce credit risk.
But if everyone cuts spending at the same time:
Consumption ↓
Investment ↓
Sales ↓
Employment ↓
Income ↓
Consumption ↓ further
The result can be a negative feedback loop.
This is why economy-wide deleveraging is much more complicated than one person simply paying off a loan.
16. How Can a Deleveraging Process Unfold?
Ray Dalio’s framework highlights several forces that can operate during a major deleveraging, including debt reduction, spending cuts, monetary easing, and transfers of income and wealth. He describes different ways these forces can combine depending on the circumstances.
For a beginner, think of several possible channels:
① Actual Debt Reduction
Borrowers repay principal or creditors accept losses.
② Economic Growth
If incomes and economic output grow faster than debt, the debt burden can become easier to manage relative to income.
③ Inflation
When nominal debt remains fixed while prices and nominal incomes rise, the real burden of that debt can decline.
But inflation also creates redistribution and economic costs, especially for savers and fixed-income investors.
④ Monetary and Fiscal Policy
Lower interest rates, asset purchases, fiscal support, and other policies can be used to prevent a disorderly economic contraction.
The important idea is:
Deleveraging is not simply “destroying debt.” It is the broader process of bringing debt burdens back to a more sustainable level.
17. Deflationary and Inflationary Deleveraging
Dalio’s framework distinguishes between different ways a major deleveraging can unfold.
Deflationary Deleveraging
A simplified path might look like:
Debt reduction
↓
Asset-price declines
↓
Lower spending
↓
Deflation
↓
Economic contraction
The Great Depression is often used as a historical comparison for this type of dynamic.
Inflationary Deleveraging
Another possibility is that monetary and fiscal policies contribute to:
Higher nominal demand or prices
↓
Lower real value of fixed nominal debt
This can reduce the real debt burden in some circumstances.
But actual crises do not always fit neatly into one category.
Real-world deleveraging can contain a mixture of:
- Deflation
- Inflation
- Recession
- Monetary easing
- Fiscal policy
- Debt restructuring
depending on the institutions and policy choices involved.
18. Does the Long-Term Debt Cycle Predict the Next Crisis?
No—not precisely.
This is one of the most important points to remember.
The long-term debt cycle is useful as a historical framework, but it is not a calendar.
It does not mean:
“Every 60 years a crisis must happen.”
Nor does it mean:
“The next crisis will look exactly like 1930 or 2008.”
Countries differ in:
- Monetary systems
- Debt composition
- Financial regulation
- Demographics
- Productivity
- Fiscal institutions
- International capital flows
So the framework is more useful for asking:
“What risks become more important when debt grows much faster than income?”
rather than:
“When exactly will the next crisis happen?”
19. How Large Is Global Debt Today?
When discussing global debt, it is important to define exactly what is being measured.
Total global debt and global public debt are not the same thing.
Total debt can include:
- Households
- Companies
- Governments
- Financial institutions
According to data from the Institute of International Finance reported by Reuters, global debt reached roughly $353 trillion at the end of the first quarter of 2026, with global debt-to-GDP around 305%.
Source: Reuters — Global Debt Hits Record Near $353 Trillion
That does not mean humanity has to repay $353 trillion tomorrow.
Debt has different maturities, currencies, creditors, and borrowers. Some debt is continually refinanced, while financial assets on the other side of the balance sheet belong to lenders and investors.
Public debt is a separate measure.
The IMF’s April 2026 Fiscal Monitor estimated that global public debt rose to just under 94% of GDP in 2025 and projected it to reach 100% by 2029 under its baseline.
Source: IMF — Fiscal Monitor, April 2026
These figures describe different parts of the global debt picture and should not be mixed together.
20. What Should You Watch in a Debt Cycle?
You do not need to memorize hundreds of debt statistics.
Start with four questions.
① Is debt growing faster than income?
Look not only at absolute debt, but also at ratios such as:
Debt / Income
or:
Debt / GDP
② How high are interest rates?
The higher the debt burden, the more important refinancing costs become.
③ Are asset prices rising together with leverage?
Rapid increases in asset prices financed by rising borrowing can create vulnerabilities.
④ Is the economy generating enough income and productivity to service the debt?
This is one of the most important questions of all.
A country can carry more debt if its income, productivity, and cash flows are also growing strongly.
21. Why Does the Long-Term Debt Cycle Matter?
Now connect this idea to the topics we have already studied.
We looked at:
→ How interest rates affect bond prices and yields.
We studied:
Inflation, Deflation, and Stagflation
→ How prices and economic activity interact.
We examined:
Quantitative Easing
→ How central banks can use asset purchases when conventional policy becomes constrained.
And we looked at:
Exchange Rates and the Current Account
→ How interest rates, capital flows, trade, and currencies interact.
The long-term debt cycle connects these ideas.
To see how debt, interest rates, capital flows, and currencies connect across borders, see Exchange Rates Explained.
A simplified chain looks like:
Debt Growth
↓
Credit Expansion
↓
Spending, Investment & Asset Prices
↓
Inflation or Deflation Pressure
↓
Interest Rates & Monetary Policy
↓
Bonds, Stocks & Exchange Rates
↓
Economic Growth & Debt-Service Capacity
This is the larger picture that makes individual economic concepts easier to understand.
Conclusion
The idea of a long-term debt cycle can sound complicated at first.
But the core idea is relatively simple:
Credit can increase today’s purchasing power by borrowing against future income.
That can help businesses invest, households buy homes, and economies grow.
But if:
Debt grows much faster than income and repayment capacity
the system can become increasingly vulnerable.
Eventually, some form of adjustment may become necessary.
That adjustment is deleveraging.
The process can involve:
Interest rates → Debt service → Asset prices → Inflation or Deflation → Monetary policy → Economic growth
Ray Dalio’s long-term debt cycle is useful because it puts these relationships into one historical framework.
But it is best viewed as:
A lens for understanding debt crises—not a guaranteed forecast of the future.
The goal of learning this framework is not to predict the exact year of the next crisis.
It is to recognize the questions that matter:
Is debt rising faster than income?
Are asset prices increasingly dependent on leverage?
Can borrowers afford higher interest rates?
Is the economy generating enough growth to service its debts?
Once you start asking those questions, economic news becomes much easier to connect.
Debt, credit, interest rates, inflation, bonds, stocks, currencies, and economic growth stop looking like separate topics.
They start looking like different parts of the same economic system.